Diablo Canyon Stabilizes the California Power Grid - and reduces pollution
The plant makes a surprisingly large contribution to both parameters
A fellow Diablo Canyon advocate recently asked me some questions about the roles of California's only nuclear power plant. Those questions inspired me to investigate further using data from the California Independent System Operator's (CAISO's ) website.
Diablo Canyon produces roughly ten percent of California's in-state dispatchable (under human control) power. The plant sends power to the grid via a trio of 500 kilovolt AC power lines.
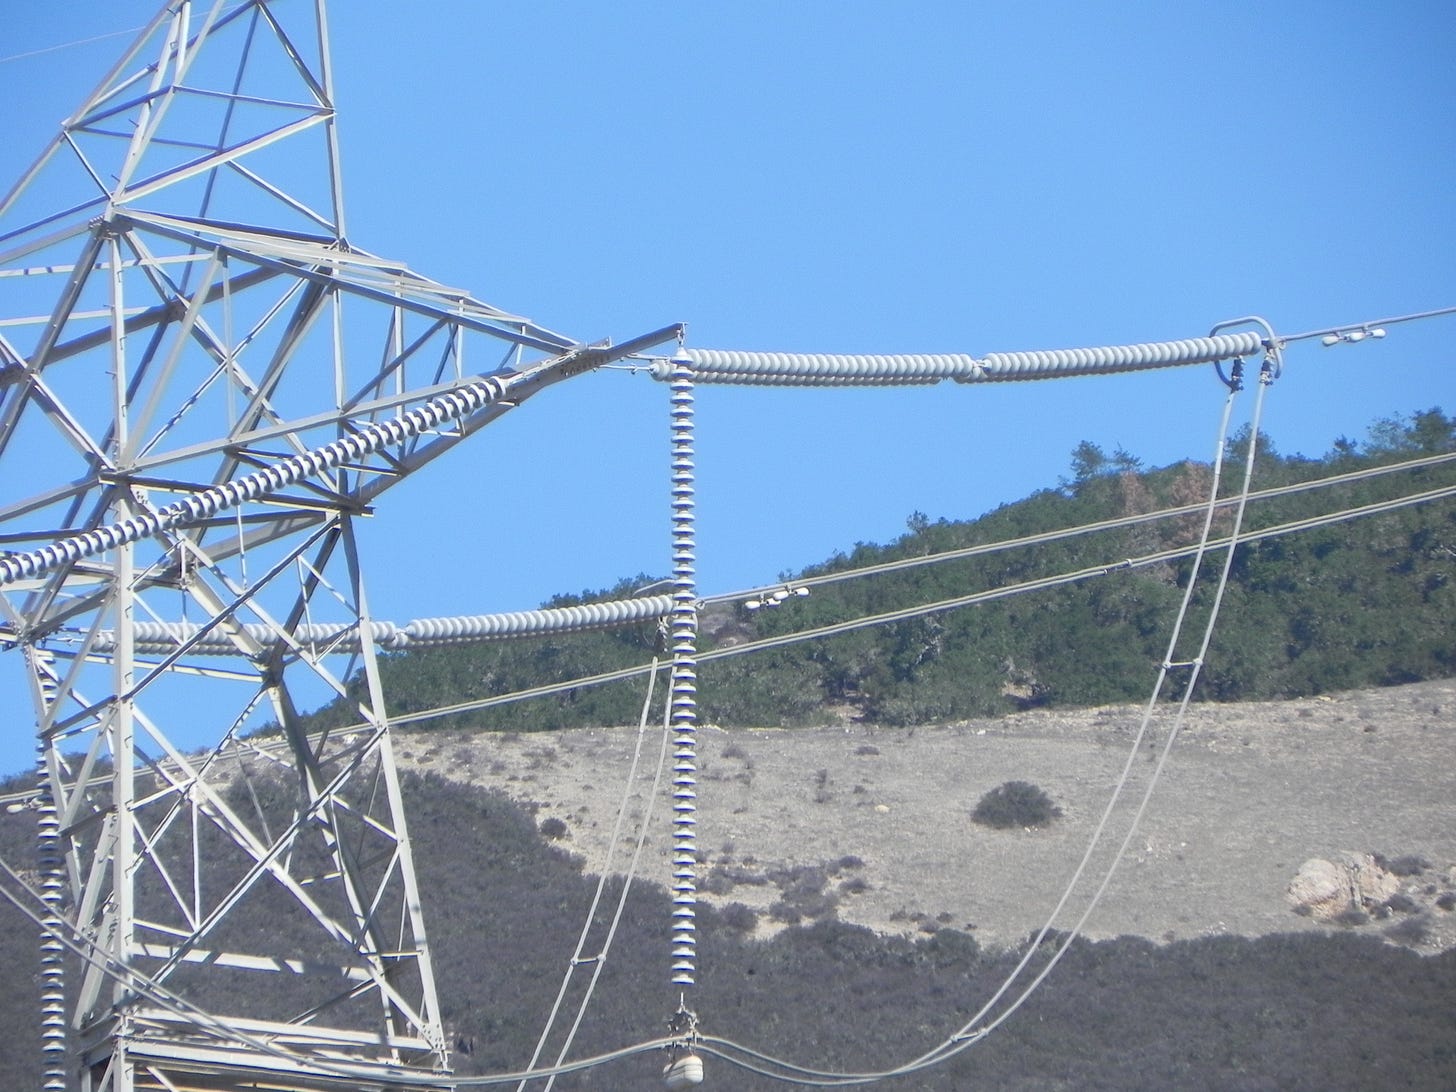
Here's my 2014 photograph taken during a plant tour of one of the 500 kV AC lines between the plant and the distribution switchyard. To provide a sense of scale, the horizontal string of insulators is about 30 feet long. The plant overlooks the Pacific Ocean. The insulators are longer at this location since the salt deposition from the nearby ocean diminishes the effectiveness of the insulators.
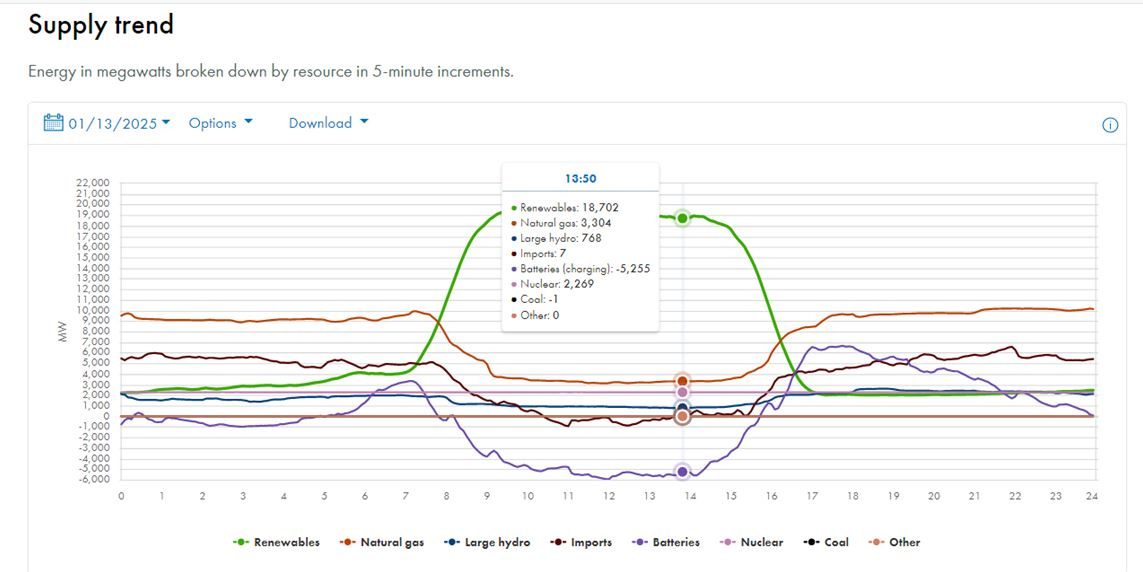
CAISO provides near-real-time and archived information about California power generators that supply the grid at the section of their website titled, "Today's Outlook." https://www.caiso.com/todays-outlook/supply
This 24 hour long graph of the contribution versus time of various energy sources for the CAISO grid on January 13, 2025 will be discussed in greater detail later in this article. The highlighted time (1:50 PM) is displayed using 24-hour time.
Diablo Canyon's contribution is typically a horizontal line during the entire 24 hour day. The present power level shown on a light brown line is about 2,270 megawatts, where a megawatt is a million Watts. Diablo Canyon power supplies the work-related and residential energy needs of about 3 million Californians. This article will also discuss how these relative power levels change when one or both of Diablo Canyon's twin reactors have their power output levels reduced during a full or partial outage. These adverse changes would occur permanently if Warren Buffett's goal of needlessly shutting down Diablo Canyon for commercial gain is successful.
What is California's Critical Synchronous Grid Inertia (SGI) level?
GreenNUKE's analysis begins with the 2018 Energy Reliability Council of Texas (ERCOT) analysis regarding SGI. https://www.ercot.com/files/docs/2018/04/04/Inertia_Basic_Concepts_Impacts_On_ERCOT_v0.pdf Section 6 in this ERCOT document discusses critical inertia, (i.e., the minimum level of system inertia at or above which the ERCOT system can be operated reliably with current frequency control practices). In power grids including California's, nuclear power plants provide the greatest amount of necessary SGI. SGI is quantification of the ability of large rotating machines such as the twin generators at Diablo Canyon Power Plant (DCPP) to instantaneously interconvert rotational kinetic energy into alternating current (AC) electrical power. Each of DCPP's twin generators has about a million pounds of rotating mass. SGI is proportional to MVARs or megavolt-amperes reactive. Each of DCPP's generators is rated at about 1,300 MVAR. The capacity of each generator is 1,135 megawatts (MW.) The ratio of MVARs to MWs is the power factor, which is typically about 0.8 since most loads seen by the grid are inductive loads from polyphase motors. (To learn more, please see the informative discussion at https://www.quora.com/Why-does-a-generator-have-its-capacity-rated-in-megawatts-MW-instead-of-megavolt-amperes-reactive-MVAR ) Another informative Substack is KiloVAR 1959's at https://substack.com/@kilovar1959/posts One of his relevant posts on October 30, 2024 regarding SGI is titled, "Big Iron Rolling."
See also the relevant March 4, 2024 GreenNUKE Substack article, "Why is Grid Inertia Important? Without sufficient synchronous grid inertia, the grid becomes unstable and a blackout occurs." https://greennuke.substack.com/p/why-is-grid-inertia-important The 35 comments further extend the concepts in the article.
Unlike California which imports roughly 1/3 of its annual total electric power consumption of about 300 terawatt-hours (TWh - a TWh is a billion kilowatt-hours) ERCOT chooses to have minimal interconnections with adjacent RTOs and ISOs. This lack of grid interconnection implies that ERCOT needs to be self-reliant in insuring there is adequate appropriate in-state generation for grid stability. Since the subsidy-seekers have been very active in both California and Texas, there is a glut of solar and wind power generation in both states. As the March 4, 2024 GreenNUKE article notes, solar, wind, and batteries are inverter-based resources (IBRs.) The laws of physics and electrical engineering yield the result that IBRs fail to provide significant amounts of SGI. (Thus, a power grid comprised 100% of IBRs would be inherently unstable - it would promptly fail.) ERCOT observes that during times there is abundant solar and wind generation on their grid, some of the solar and wind generation must be curtailed. Instead, Texas power generation plants supplying necessary SGI must be operating 24-7. ERCOT turns to its nuclear power plants, coal-fired power plants, some large hydroelectric plants and some natural gas fired plants to provide the stabilizing SGI. On page 12 of 25 of the 2018 ERCOT article, 100,000 MW*s is determined to be the critical inertia required for ERCOT. On page 5 of 25, Table 1 shows a Texas nuclear generator provides between 5,344 MW*s and 6,530 MW*s of SGI or between 5 to 6 percent of the state's critical inertia. There are four nuclear power reactors in Texas which implies that these reactors typically supply about 1/4 of the state's critical inertia. (To compare the two state power grids, California's September 6, 2022 peak load was 52,061 MW. On August 10, 2023, the Texas peak load was 85,508 MW.)
ERCOT provides the value of system inertia on their publicly-visible dashboard. On January 15, 2025 at 11:41 PM CST, the inertia value was 293,976 or almost three times the critical inertia value shown above. https://www.ercot.com/content/cdr/html/real_time_system_conditions.html Unfortunately, CAISO does not provide the real-time value of the state's available inertia.
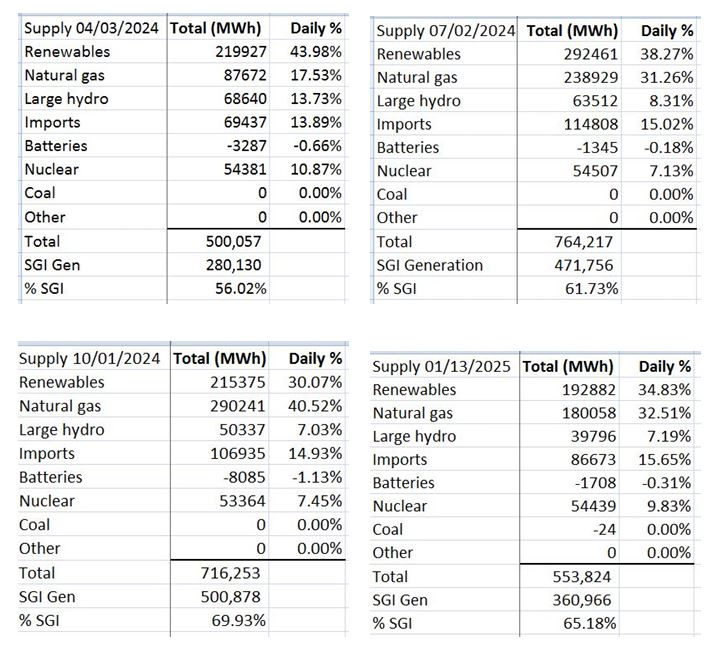
CGNP can obtain a sense of the CAISO grid's critical inertia requirement by examining the energy sources used during times of high solar and wind generation. We are able to deduce during those intervals that significant amounts of the California's solar and wind generation must be curtailed to maintain grid stability. To minimize the contributions of imports, we chose 5-minute-long time intervals where the amount of imports were slightly above zero but small enough to disregard. Furthermore, because batteries are not an energy source, we chose times when batteries were charging to absorb excess electric power. Solar and wind are IBRs as noted above. The energy sources contributing to California SGI were natural gas fired generation, large hydroelectricity, and nuclear power. DCPP was operating at full power during each of the selected intervals. We show the four time intervals from April 3, 2024 to January 13, 2025 we chose below. The dates are roughly 3 months apart.
The range for "SGI Gen" (SGI Generation) is between 6,348 MW and 12,668 MW with the percentage of total generation between 25.34% and 40.32%. Clearly, DCPP's generation is a significant fraction of the state's SGI. Solar and wind curtailment is observed on all dates. On December 10, 2024 there were 20,093 MW of solar and 8,345 MW of wind dispatched by CAISO for a renewables total of 28.438 MW per https://www.caiso.com/documents/key-statistics-nov-2024.pdf The maximum renewables generation was only 21,536 MW on July 2, 2024. (While the above charts claim there is no coal in the California generation mix, CGNP has shown coal imports are hiding behind the California-specific legal euphemism of "unspecified power." See CGNP's April 5, 2022 OpEd in Capitol Weekly https://Tinyurl.com/DCPP-VERSUS-COAL)
CGNP believes it is informative to examine the relative contributions of each energy source during an entire day. Here are those spreadsheets for each of the four dates above.
The daily spreadsheets document the importance of "SGI Gen" (SGI Generation) to CAISO. The percentage of SGI Gen ranges from a low to 56.02% to a high of 69.93% - more than half in all cases and almost 3/4 on October 1, 2024. Conversely, the contributions of renewables are a mere 30.07% on October 1, 2024. (These statistics rebut the claims of renewables advocates that coal, natural gas. large hydroelectricity and nuclear can be replaced by solar and wind.) On all four dates, imports provided a greater share of power than large hydroelectricity. This is significant since coal-fired imported power hides behind the California-specific legal euphemism of "unspecified power." Nuclear power's daily contribution ranges between 7.13% and 10.87%.
A glance into California's future if Warren Buffett's anti-DCPP lobbying is successful
In three weeks of April, 2007 I was employed as a laborer at DCPP just before the 1R13 outage. While I completed and passed all of the radiation worker training, my tasks included sweeping sidewalks, emptying trash, and helping to pour concrete. I talked with my laborer colleagues about one of the unpleasant outage-related tasks which was scraping barnacles and filter feeders from all four walls of the four ten foot by ten foot cooling water tunnels. These organisms grow so aggressively they must be removed every nine months or so. The total length of the four tunnels is about one mile. My coworkers who had done this task during earlier outages told me they looked forward to a long hot shower at the end of each of the scraping shifts to remove the smelly residue from their bodies despite wearing personal protective equipment.
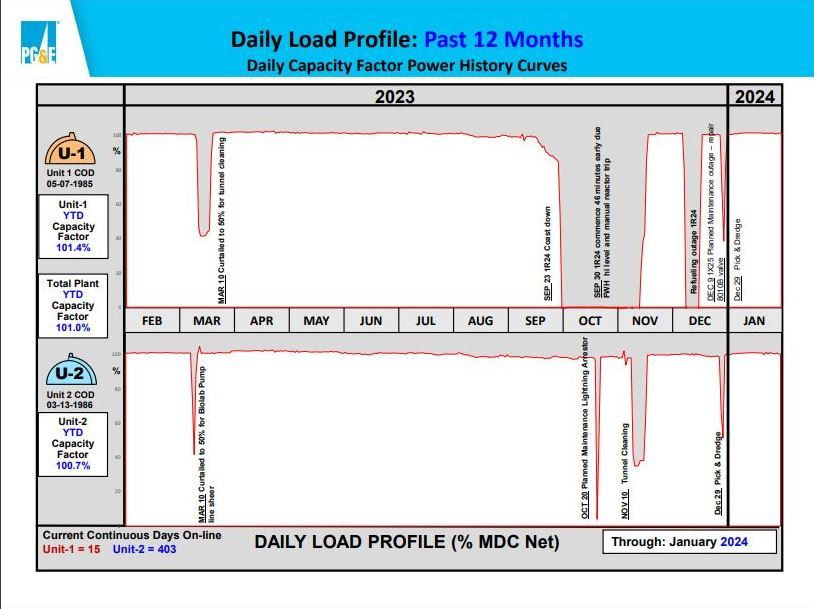
Since CGNP representatives attend each of the three annual Diablo Canyon Independent Safety Committee (DCISC) meetings, we are familiar with plant owner PG&E's State of the Plant briefings which occur during each meeting. One of the slides PG&E always presents shows a slide of DCPP's power output during the previous 12 months. This slide was shown at the February 21, 2024 DCISC meeting.
DCPP Daily Load Profile, courtesy of PG&E. The Unit 2 tunnel cleaning occurred from roughly November 11 -14, 2023. Unit 1 was already offline for a refueling outage from the beginning of October, 2023 through mid-November 2023. Diablo Canyon's total output had to be reduced to a low value during the Unit 2 tunnel cleaning.
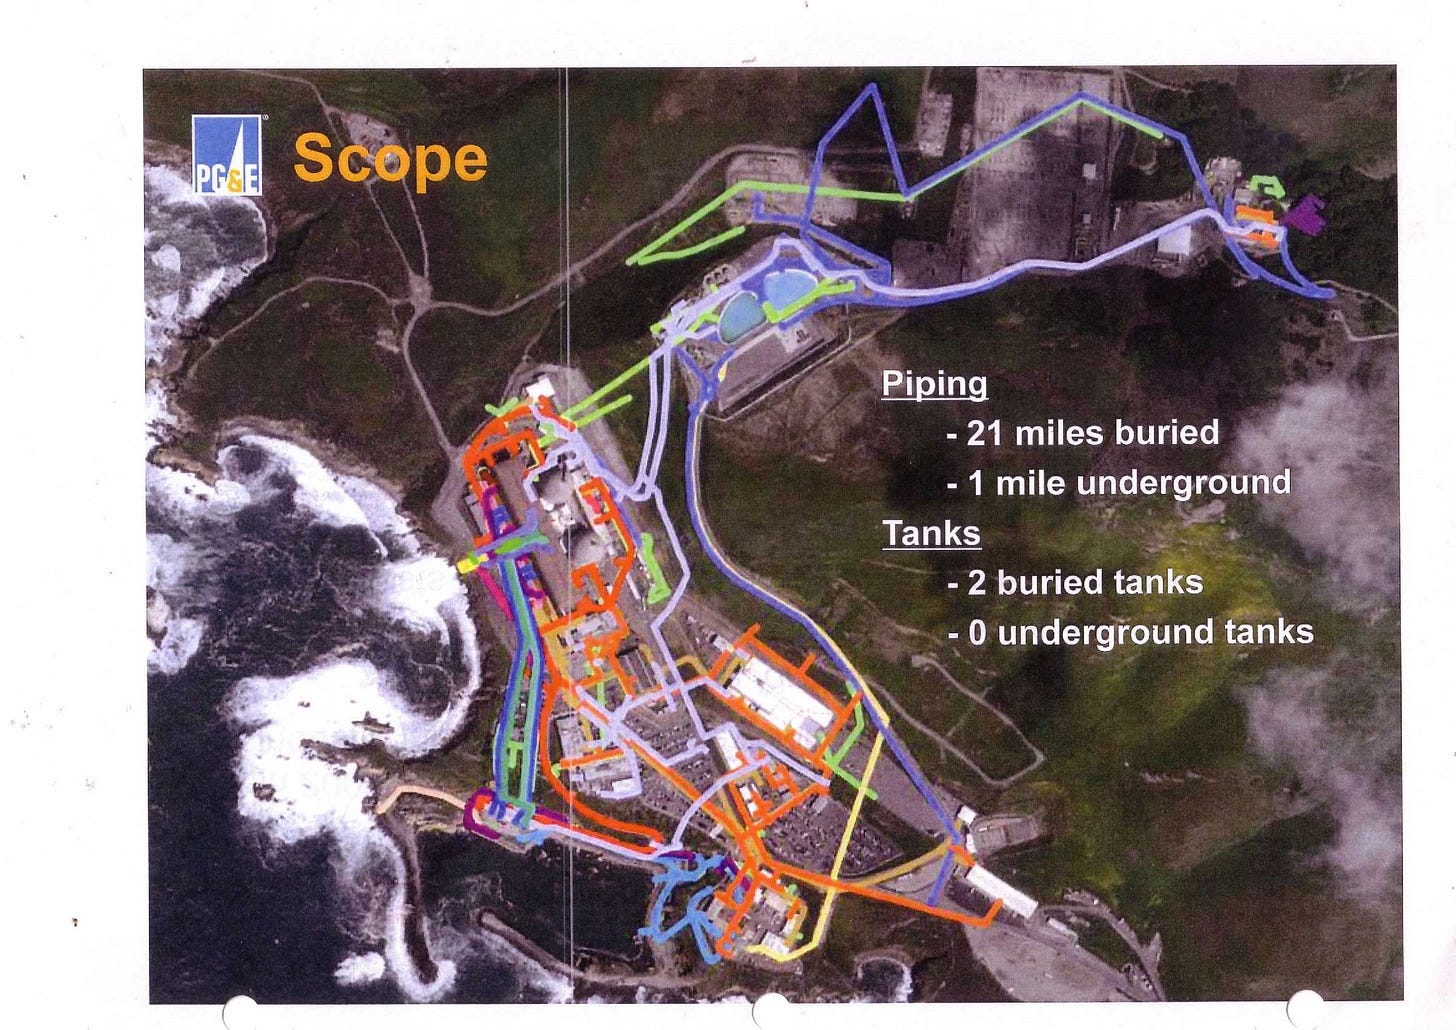
A pair of slides shows the large scale of the tunnel cleaning project. There are two tunnels per reactor.
A pair of ten-foot-by ten-foot DCPP cooling water tunnels during construction during the early 1970s, courtesy of PG&E. The workers provide a sense of scale.
The underground pathways of the cooling water tunnels are shown in light turquoise lines on this 2014 PG&E slide. The tunnels begin at the inlet cove at the lower left hand side of the slide. They continue to the midpoint of the turbine building. The total length of the cooling water tunnels is about one mile.
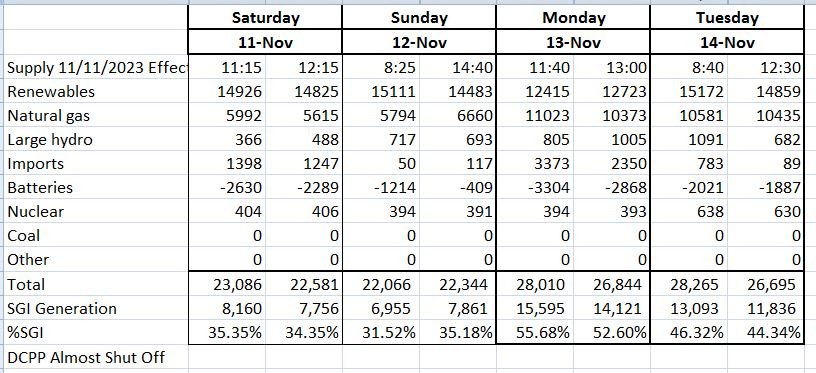
Examination of the five-minute long interval spreadsheets and the daily spreadsheets during November 11-14, 2023 when DCPP was almost completely shut down is instructive.
Imports were a much higher percentage even during the intervals when imports were selected to be minimal.
The daily spreadsheets when DCPP was almost completely shut down reveal additional details.
Daily Imported MWh needed to be higher to compensate for the modest DCPP power production. On the previous four dates while DCPP was at full-power, The percentage of SGI Gen ranged from a low to 56.02% to a high of 69.93%. On the four days that DCPP was almost completely shut down, the SGI Gen increased from a low of 69.84% to a high of 78.95%. This increase in daily SGI Gen shows how DCPP produces significantly more SGI than the required fossil-fired replacement power.
Supplying the DCPP replacement power is already very lucrative for Warren Buffett. For details, see, the October 16, 2024 GreenNUKE article, "Protesting California's Ongoing Nuclear to Coal Transition - Part 1 - CGNP protests PacifiCorp's environmental hypocrisy to their CEO" https://greennuke.substack.com/p/protesting-californias-ongoing-nuclear
If Warren's lavishly-funded lobbying campaign to shut down DCPP at the state and federal level is successful, he will be making considerably more profits at PacifiCorp than he already makes providing replacement power to Southern California Edison for SONGS power, as he will have pricing power with DCPP shut down.
As we've noted previously, your tax-deductible donations to CGNP can help us to protect DCPP for the benefit of California ratepayers and for the benefit of the environment. Please mail your checks to Californians for Green Nuclear Power, Inc., 1375 East Grand Ave Ste 103 #523, Arroyo Grande, CA 93420-2421 Thank you.





Here's a big, "Thank you" to the network of GreenNUKE subscribers and commenters that started slightly more than ten months ago. We now have 557 subscribers! There are 22 GreenNUKE articles and short commentaries. We've also cross-posted several articles from other Substacks.
Please continue to help GreenNUKE to grow by sharing our content with your friends and colleagues and encouraging them to subscribe. We are aware that Diablo Canyon **opponents** will be boosting their California public outreach in 2025. One of the ways to neutralize those typically fear-based narratives is to explain the physics, engineering, and economics in ways the general public can understand. This public outreach is central to GreenNUKE's mission.
Amazingly good article. In simple terms I explain it like this.
Most people know that AC power is a sine wave.
That's the ideal, as Nicolai Tesla created it a century ago.
In reality motors and appliances load the grid awkwardly compared to the ideal incandescent light bulb. A distorted sine wave has a "poor power factor" and the grid equipment is far less efficient. Transformers and wires get hotter while doing less useful work.
Hot equipment can reach a breaking point and cause blackouts.
Now it is actually true that solar and batteries COULD lend inertia to the grid.
Software can predict where the "heavy Iron" should be. Apparent.com has tech for this.
The problem is "The Agents of Chaos" don't want a stable grid. The Enron's of the world speculate on the momentary price of electricity. They LOVE Solar because because Every Afternoon at 4:20 the Solar Systems quit working, maybe they are smoking weed, I dunno. That manufactured emergency is an opportunity only Gas Frackers can save us from, demanding Heroic prices, for the little bit of gas it takes to avoid local blackouts.
So the Solar stability option is suppressed, even in California, because the utilities don't want it-- they make huge amounts of money at the CAISO Casino, betting on every cloud bank approaching a solar farm as if it were a race track. Imagine how the traders must hate nuclear! How do you win a bet on an energy supply that operates 95% of the time and only buys fuel once a year, and probably has a 10 year fuel contract? Nothing for Enron's "Smartest Guys In The Room" to do to satisfy the gambling addiction.
It would be funny but out of control speculation probably makes California household and industrial bills MUCH higher than they would be in Washington or Utah.
So it's hard to make the grid stable when the money is made on it being unstable. Which is of course why America created utility regulators in the first place, but after nearly a century folks are ready to get fooled again.
There is nothing wrong with California's grid from Wall Street's perspective. It's causing wildfires and poverty and destroying all manufacturing, even data centers in California. But Utility shareholders are happy. Its sad when Wall Street's short term profiteering is the dominant factor in energy policy. Herds of MBA's playing zero-sum gains boosting their favorite stocks aren't serving the people well at all.